


Put an end to data clutter in the food production process—AI as the game-changer in data analysis

Why a MES alone doesn’t solve any problems. Why no one looks at most of the data in a dairy. And where artificial intelligence really makes a difference in measurement analysis.

“We’re collecting all the data now.” We’re hearing this phrase more and more often in dairies, breweries, and malthouses. And it’s true: the sensors are there, the network is there, and storage costs next to nothing. But in many companies, absolutely nothing happens after that. Collected. Stored. Unused.

Data isn't a benefit.
Analysis is.

Let’s do the math: a dairy, one day.

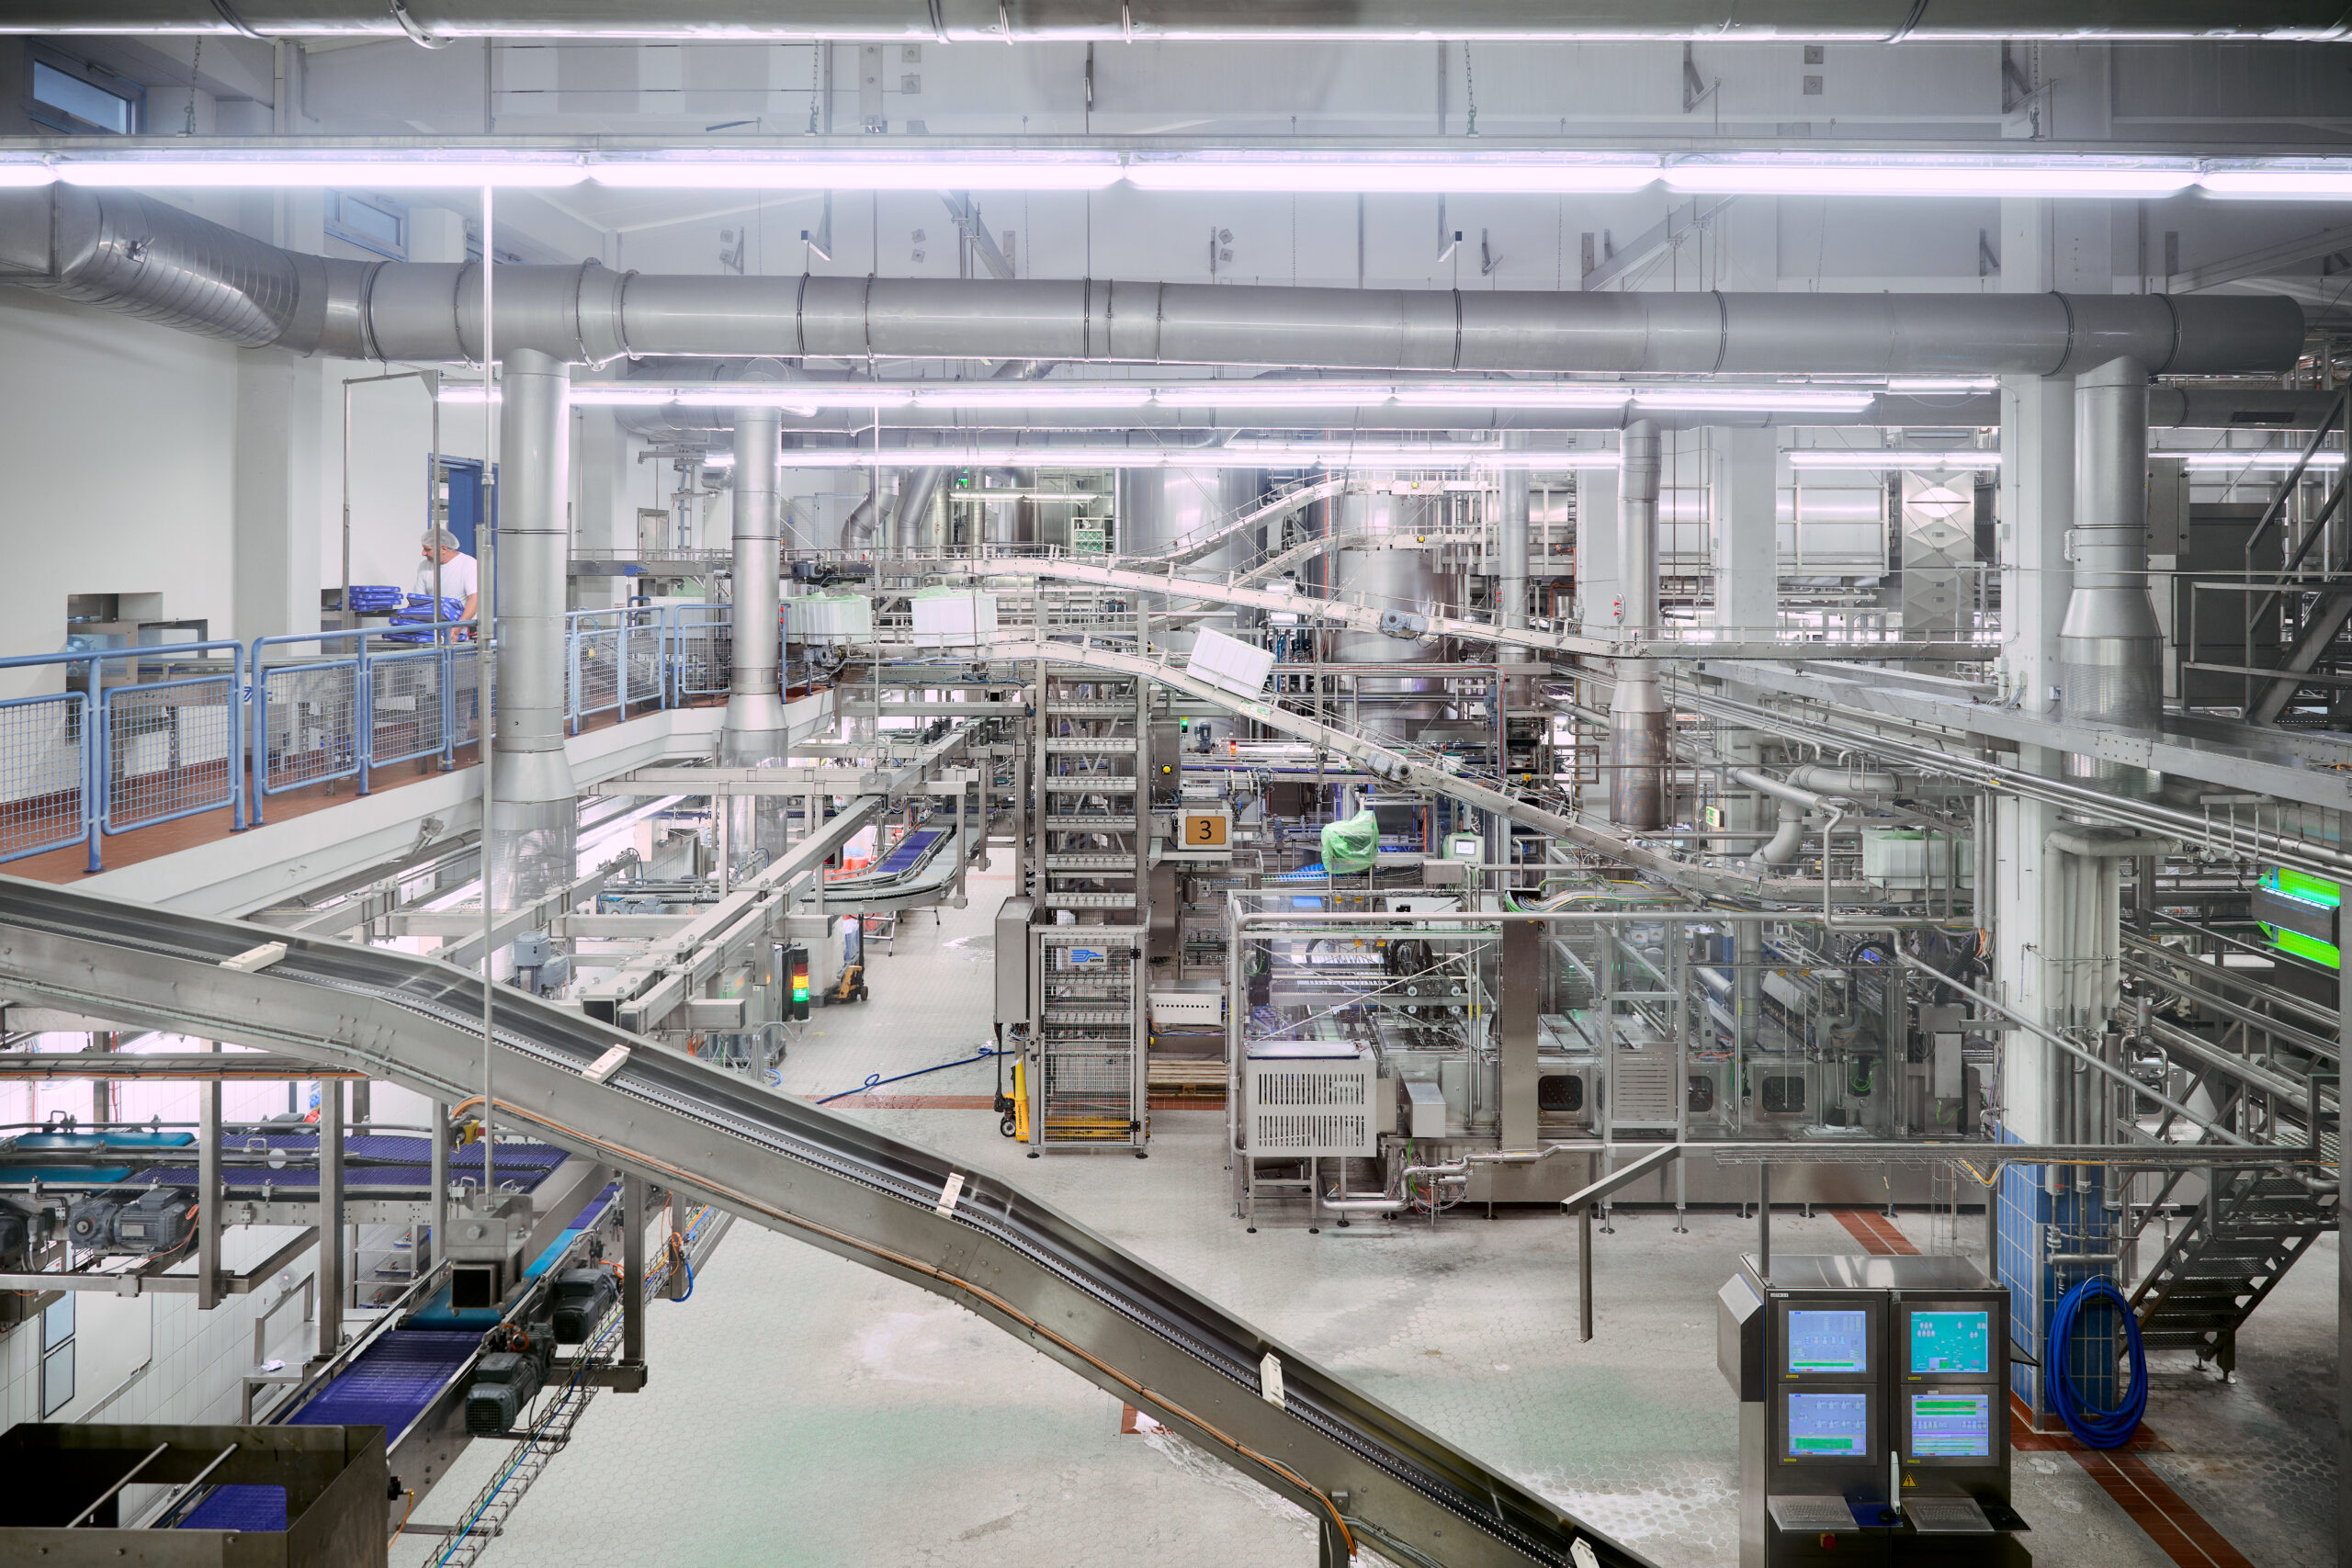
Let’s take a medium-sized dairy as an example. Raw milk reception, standardization, heating, fermentation, bottling, CIP cleaning. There are about 1,500 measurement points distributed throughout the facilities: temperatures, pressures, flow rates, levels, conductivity, valve positions, and motor currents. Nothing out of the ordinary—this is standard process control technology.

Measurements taken every second = 1,500 readings per second

Values per hour

Values for a 24-hour production day

Raw and unfiltered, that amounts to about 2.6 gigabytes per day. Just under 900 million data points per week. About 47 billion per year.
And now for the big challenge: How many of these readings does a person actually see? The shift supervisor has three or four screens on the control panel, a few trend graphs, and a report at the end of the shift. Of these, a few hundred readings are consciously evaluated. For every value that a person actually looks at, there are more than 200,000 that no one looks at.
This isn’t a digitization problem. The operation has long since been digitized. It’s an analysis problem.

A MES records data. It does not make decisions.

A MES (Manufacturing Execution System) provides visibility into production: orders, batches, downtime, consumption, and traceability. This is the prerequisite for everything that follows. But it is, after all, just the prerequisite. An MES collects and displays data. It does not draw conclusions, and it certainly does not initiate improvement measures. The only exception is detailed planning, where an MES decides which order to process next—but even here, it does so only according to predefined algorithms, not common sense.

“OEE dashboards don't add any value. They just visualize data that I already have. ”

Thomas BuxCEO of planemos

It’s not about more data, but about having the right data.

Data clutter isn’t created when data is stored. It arises from aimless data collection. It’s worth having a clear strategy to minimize data clutter.
Three questions to ask before entering a value:
1

What action should this value trigger?

If the answer is “We’ll see,” it’s junk data.
2

Who makes this decision?

Shift supervision, maintenance, quality management, CEO—each role requires different metrics, at different levels of detail and at different intervals.
3

What happens if the value is missing?

If no one notices, he can leave.

If you don't know the destination, you can't find the way.

Thomas BuxCEO of planemos
It sounds trivial. In practice, a significant portion of the wish list doesn’t make it past these three questions. That’s a good result, not a bad one.
Metrics that stand up to these three questions might look like this, for example: Detergent consumption per CIP cycle and product type. Conductivity at the end of the pre-rinse. Downtime per product changeover. Energy consumption assigned to a specific job. Four metrics, each backed by an action that truly makes a difference.

Where AI really makes a difference in measurement analysis—and where it doesn’t.

Only once it is clear what data is being collected and why is it worth considering artificial intelligence. And that requires precision, because the term has become overused in the market.
This isn’t AI, even though it’s often marketed as such:

Limit value monitoring

“Conductance above threshold, block batch” is a rule, not a learning process.

Trend curve and dashboard

Visualization of values ​​that already exist.

Predictive maintenance based on operating hours

a maintenance interval calculated using a formula.

Energy management to balance out peak loads

Control technology with a priority list.

Rule-based recipe optimization

-defined logic, not pattern recognition.

All of that is useful. Some of it is among the most cost-effective things you can do in a dairy. It has nothing to do with AI, though.


True AI learns from data. It works with patterns and probabilities, improves as more data becomes available, and is not predictable on a one-to-one basis. In terms of measurement analysis, this means specifically:

Pattern recognition using large amounts of data.

A person cannot identify the relationship between raw milk parameters, inlet temperature, residence time, and scrap rate because they cannot grasp the full scope of the data. A trained model provides candidates for such relationships—and a process engineer verifies whether they are correct.

Quality inspection with AI vision.

Detect defect patterns that no one has previously defined, at higher line speeds.

Forecasting fluctuations in commodity prices.

Improved planning of raw materials, logistics, and personnel.

Explainable AI (XAI).

Processes whose results remain traceable and interpretable. In environments subject to audits—IFS, HACCP—this is not a mere nicety, but a requirement.

This difference determines whether an investment delivers what is promised. And it does not change who ultimately makes the decision: A model provides guidance and indicates a probability. Whether the production line is reconfigured, the formula is adjusted, or the heat exchanger is cleaned sooner is always decided by a person.

From measurement to action: A step-by-step approach to continuous improvement.

1

Define the goal.

What should be improved—waste, cleaning water, service life, or energy per metric ton? A goal, formulated in measurable terms.
2

A few reliable metrics instead of a lot of figures.

Better to have five key metrics that are accurate and for which someone is accountable than fifty that are overwhelming or ignored altogether.
3

Analyze, not just display.

Actual data versus target data, across product types, shifts, and production lines. This is where insights are generated—using traditional statistics and, where the volume of data allows, machine learning algorithms.
4

Determine the action and follow up with a measurement.

Without that final step, even the best analysis is just a report.

After that, the real work begins: the continuous improvement process (CIP). An MES is the starting point, not the end result.

Conclusion

It’s not the one who measures the most who wins, but the one who analyzes their data.

Collecting 130 million data points a day is no longer an achievement—technology does that as a matter of course. The real achievement lies in extracting the twenty figures from that volume that support a decision—and turning them into an action that makes a difference in production.
You don’t need a complex system for this. You need a clear goal, clean data, and someone who understands the process. And then, in the right places, AI as well. We come from the ground up and know the process. That’s why we start with your goal, not with a list of features.

Are you looking for an MES that’s perfectly suited to your food production process?

Then we have just the thing for you. Book a no-obligation consultation now.

  • Let’s work together to identify your company’s needs
  • A first look at our planemos MES
  • Let’s answer your questions and discuss possible next steps

Thomas Bux

Email: hub@planemos.de
Phone: +49 9131 92 796 0

Get in touch with us